Search Docs by Keyword
Sequencing
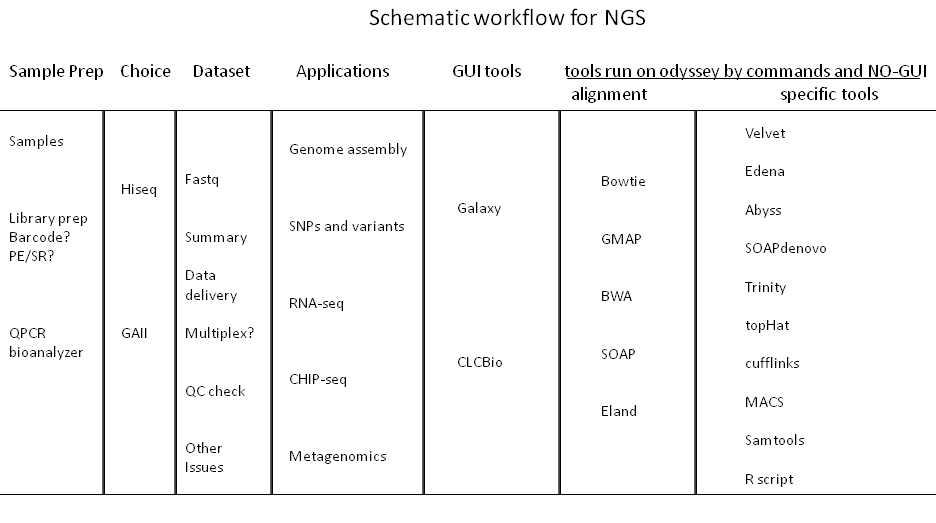
Applications and options for high through-put sequencing
A wide array of available sample preparation methods serve to enable diverse applications, including: whole-genome and candidate region resequencing, transcriptome analysis, small RNA discovery, methylation profiling, and genome-wide protein-nucleic acid interaction analysis. The Hiseq2000 and GAII can accommodate DNA, ChIP-Seq, RNA-Seq, Paired-End, and Mate Pair sequencing experiments. Service with alignment with Eland algorithm against the genome of your choice is provided. Here is the price list.
Usually, a 32-50 bp single read will provide an unambiguous match to any genome. It is therefore suitable for ChIP-seq, small RNA, and mRNA-seq applications where a reference genome is available. Longer single reads can be used for SNP discovery, initial assemblies of genomes or transcriptomes, and assemblies of simpler, smaller genomes. Paired end reads substantially facilitate assemblies of all genome sizes. Paired end reads can also help resolve differences among repeat regions and as a result can be use in transcriptome projects to distinguish family members as well as identify alternative splicing.
We facilitate the Bauer sequencing core to deliver raw sequences of high quality as well as basic alignment with Eland algorithm against the genome of your choice.
Turn around time
Normal turn around time is 5-10 business days for final sequence and alignment delivery after the machine releases the intermediate files.
Typical reason for the time variation and issues extending running time include: Pair-Ends (PE) sequencing needs two times more time than Single Read (SR). Multiplexed samples take extra time to process the de-multiplex step, and PE coupled with multiplex takes the longest time.
Occasionally, the pipeline is interrupted with various errors, including I/O errors embedded during datasets transferred from solexa machine to FASRC fileserver via network, in which thousands of files are involved. This will take a great deal of time to trouble shoot and fix.
Storage time before deletion
After delivery of the seq datasets, you have one month to contact us and inquire about the datasets if you have any issue with it before the relevant files deleted since we have limited space on our server.
Please make additional CD/DVD copies for your sequencing datasets. Our server has limited space and won’t keep delivered datasets. Please contact us ASAP if you have any issue with the dataset before all related files are deleted.
Data delivery
You will receive an email notice with dataset download link once it is ready. We can deliver the seq datasets to your lab folder if the lab folder of your group has been mounted on the FASRC cluster, which is available for FAS groups. Please contact rchelp@rc.fas.harvard.edu for a cluster account and lab folder mounting.
Issue with homebrew inline barcode
Sequence bias in the initial cycles, which are used to determine the coordinates of individual clusters, can cause a significant reduction in the numbers of clusters that can be analyzed on Illumina Genome Analyzers, Hiseq2000 or GAII. Image analysis algorithms are applied during the first few cycles to identify the positions of individual clusters (first 4 cycles for SCSv2.5/GOATv1.5 and SCSv2.6/OLBv1.6 or 5 cycles for SCSv2.8/OLBv1.8), which are then monitored through subsequent cycles to generate sequence data; the ability to read sequence from a lane successfully is critically dependent on the ability to correctly map coordinates of the clusters. It is highly discouraged to use homebrew inline barcodes as 5′ leading bases. It is better to use multiplex barcode kit from Illumina company for beginner.
One way currently under test to fix this problem is to manually change template generation cycles on GAII (please consult our core facility). When custom adapters, indexing sequences or other sample preparation artifacts reduce the diversity of bases in the first n sequencing cycles, the template generation cycle can be adjusted to n+1 in order to achieve the best cluster detection possible. Values of n (the number of bases to be ignored) up to 15 have been tested and validated. It is not known if system resources are sufficient to process the backload of images that are created if template generation is delayed beyond this point.
Note for Illumina barcode
If you make the library preparation with Illumina index/barcode protocol, sequences from each barcode will be sorted and put into one folder.
Here is an example:
- User Eric submits a sample to be sequenced, and the email from the core mentions “7 Eric MK4m3”.
- Lane 7 has been loaded with sample MK4m3 for Eric.
- In the output folder, all s_7 prefixed files belong to Eric. They are located at subfolders, 001, 002, 003, 004, …012, unknown, such as 001/s_7_1_sequence.txt.gz, 002/s_7_1_sequence.txt.gz etc.
- If Eric uses 3 barcodes, then files 001/s_7_1_sequence.txt.gz, 002/s_7_1_sequence.txt.gz, 003/s_7_1_sequence.txt.gz, unknown/s_7_1_sequence.txt.gz belong to Eric.
- Barcode itself has been inserted into reads id, such as TTAGGC in @ILLUMINA_0171:7:1101:3050:1998#TTAGGC/1.
- Reads have been sorted into “unknown” folder if no identified barcode associated. However, 001/s_7_1_sequence.txt.gz may not be the one containing the first index, maybe index 2 or 3. This is exactly what the Illumina pipeline outputs. We have not changed anything. We can’t match the folder order with each user’s own order of index. Actually, it is very simple to check out the barcode for each file by just looking at the first line of each file. Under linux/unix platform, try this command:
"zcat 001/s_7_1_sequence.txt.gz | head -n 8"
Here inside output first line TTAGGC is the index/barcode:
@ILLUMINA_0171:7:1101:3050:1998#TTAGGC/1

CAATCTAGATATTTATNTTCATCTTCACGNTCAATCAGAAAACCTGAAGTTCTCAAAT

TCAAGCCATGAAGGGAAAGGTTCCATGGTCATGACAACGCAGG

+ILLUMINA_0171:7:1101:3050:1998#TTAGGC/1

b_beeeeefgfggihhBBBBBBBBBBBBBBBBBBBBBBBBBBBBBBBBBBBBBBBBBBBBBB

BBBBBBBBBBBBBBBBBBBBBBBBBBBBBBBBBBBBBBB

@ILLUMINA_0171:7:1101:4802:1998#TTAGGC/1

AGCATAAACCTGTATANACAAACAAGGGANACACAAAACCAAACAAAAGATTATAAA

CAGAGGATTATTCTTTTTCTGTTTAATGGTTATTGGGCTTGAGG

+ILLUMINA_0171:7:1101:4802:1998#TTAGGC/1

bbbeeeeegffggiihBBBBBBBBBBBBBBBBBBBBBBBBBBBBBBBBBBBBBBBBBBBBBBB

BBBBBBBBBBBBBBBBBBBBBBBBBBBBBBBBBBBBBB
Acceptable range of Qscore metrics for raw sequences
For a 2×100 run for PhiX at recommended cluster densities, we say we can get >80% of bases to be above Q30. For a 2×50 run, that number is >85%. Illumina has not developed any standard of Q score metric for the final 50 bases of a 2×150 run. Internally, they can get on average >65% of the bases to be >Q30 for a PhiX lane that has our recommended cluster densities.
Tip in Q score computation
If a read ends with a segment of mostly low quality (Q15 or below), then all of the quality values in the segment are replaced with a value of 2 (encoded as the letter B in Illumina’s text-based encoding of quality scores). This Q2 indicator does not predict a specific error rate, but rather indicates that a specific final portion of the read should not be used in further analyses. This process results in the run of B’s which you may have seen at the end of some reads. NOte: for Illumina 1.5+ Phred+64, raw reads typically (3, 40) with 0=unused, 1=unused, 2=Read Segment Quality Control Indicator
Current performance specifications for GAII and Hiseq2000
| Genome Analyzer llx Performance Parameters | ||
|---|---|---|
| Read Length | Run Time (Days) | Output (Gb) |
| 1 x 35 bp | ~2 | 10 – 12 |
| 2 x 50 bp | ~5 | 25 – 30 |
| 2 x 75 bp | ~7 | 37.5 – 45 |
| 2 x 100 bp | ~9.5 | 54 – 60 |
| 2 x 150 bp | ~14 | 85 – 95 |
| Sequencing output generated using TruSeq SBS V5 kit with PhiX library and cluster densities between 508,000-630,000 clusters/mm2 that pass filtering on a GAIIx Throughput: Up to 6.5 Gb per day for a 2 x 100 bp run Reads: Up to 320 million clusters passing filter and up to 640 million paired-end reads Performance: The Genome AnalyzerIIx generates a significant yield of bases greater than Q30 Greater than 85% bases higher than Q30 at 2 x 50 bp Greater than 80% bases higher than Q30 at 2 x 100 bp |
||
| HiSeq 2000 System Performance Parameters | |||
|---|---|---|---|
| Read Length | Single Flow Cell Run Time | Dual Flow Cell Run Time | Dual Flow Cell Output |
| 1 x 36 bp | ~ 1.5 days | ~ 2 days | 95-105 Gb |
| 2 x 50 bp | ~ 4.5 days | ~ 5.5 days | 270-300 Gb |
| 2 x 100 bp | ~ 8.5 days | ~ 11 days | 540-600 Gb |
| Throughput: Up to 55 Gb per day for a 2 x 100 bp run. Reads: Up to three billion clusters passing filter and up to six billion paired-end reads Performance: HiSeq Systems provide the greatest yield of perfect reads and bases greater than Q30 Greater than 85% bases higher than Q30 at 2 x 50 bp* Greater than 80% bases higher than Q30 at 2 x 100 bp* *Install specifications for HiSeq Sequencers using an Illumina PhiX library and cluster densities between 610-678 K/mm2 that pass filtering on a HiSeq system using TruSeq v3 Cluster and SBS kits for HiSeq. Performance may vary based on sample quality, cluster density, and other experimental factors. Paired 100 bp runs typically vary in the range of 80 to 90% of bases above Q30 and paired 50 bp runs typically vary in the range of 85 to 95% bases above Q30, based on the above factors. |
|||
Output file format and Summary file
Raw sequence files are delivered as FASTQ format. FASTQ format is a text-based format for storing both a biological sequence (usually nucleotide sequence) and its corresponding quality scores. Both the sequence letter and quality score are encoded with a single ASCII character for brevity. Sequence files with alignment by Eland software are delivered as EXPORT format.
The Summary.htm file is the file you should review after your analysis is complete.
Bookmarkable Links
- 1 Applications and options for high through-put sequencing
- 2 Turn around time
- 3 Storage time before deletion
- 4 Data delivery
- 5 Issue with homebrew inline barcode
- 6 Note for Illumina barcode
- 7 Acceptable range of Qscore metrics for raw sequences
- 8 Tip in Q score computation
- 9 Current performance specifications for GAII and Hiseq2000
- 10 Output file format and Summary file